Post on YSlow was one of the earliest on this blog, as well as one of the first popular posts. I still use tool extensively. It may be somewhat cumbersome for fast checks so I picked up few web-based tools for testing site load performance since then.
What tools test
Online tools of this kind download page from link you provide and log exact details about download process. Some excel at post-load analysis while other are all about exact timing of download and render.
OctaGate SiteTimer
Fast and straightforward load timer.
site_load_octagate
Hardly feature-rich but good for quick test. Has weird habit of displaying some things that have nothing to do with page like links to RSS feeds.
Link octagate.com/service/SiteTimer
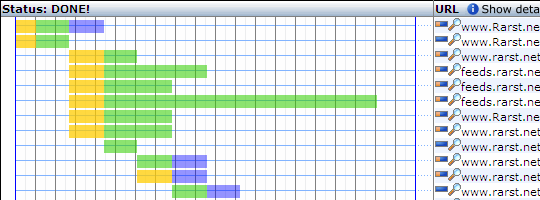
Pingdom Tools Full Page Test
Also load timer type, inspired by SiteTimer according to developers.
site_load_pingdom
Still no settings to play with, but has improved visualization, sorting/filtering capabilities for graph and summary result. Can optionally remember results of test.
Link tools.pingdom.com
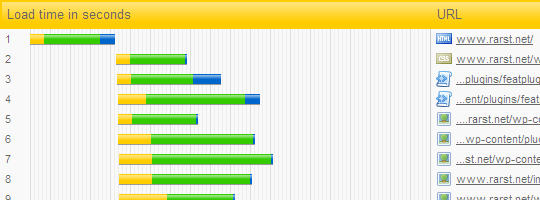
Site-Perf
Most complex of timers.
site_load_siteperf
A lot of settings to choose – like what browser to emulate, as well as limited support for password-protected pages.
Link site-perf.com
Web Page Analyzer
Post-load analyzer.
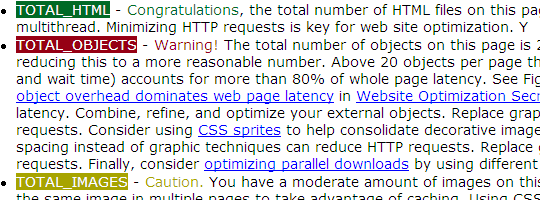
site_load_website
Calculates estimated load times on different connection speeds and provides good summaries on specific performance bottlenecks.
Link websiteoptimization.com/services/analyze
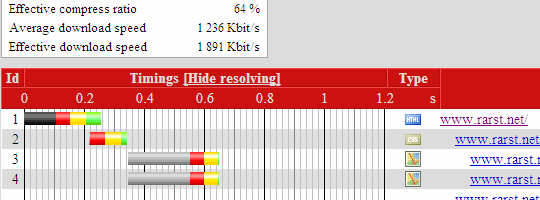
Pagetest
Technical performance analyzer.
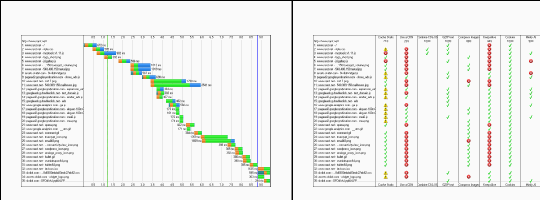
site_load_pagetest
Allows to setup repeated tests. Generates numerous graphs, screenshots and very thorough information on all of site’s components. Creates checklist of specific optimizations with estimated size improvement.
Link webpagetest.org
Overall
I had roughly sorted test by complexity of usage and amount of insight. There is no clear winner, just try each one and decide which balance of ease of use and functions you need.
PS yes, I know this blog has some performance issues at moment. No need to try each tool on me and tell me I suck at implementing what I encourage. :)
Lyndi #
Madmouse Blog tips #
Rarst #
TechZoomIn #
Rarst #
Donace | The Nexus #
Rarst #
Jonny #
Rarst #
Google Page Speed vs Yahoo YSlow | Rarst.net #
David #
Rarst #
David #
Rarst #
David #
Rarst #
David #
Rob #