Andrey “Rarst” Savchenko
200ms
interface interactivity boundary
goal 1
10ms resolution
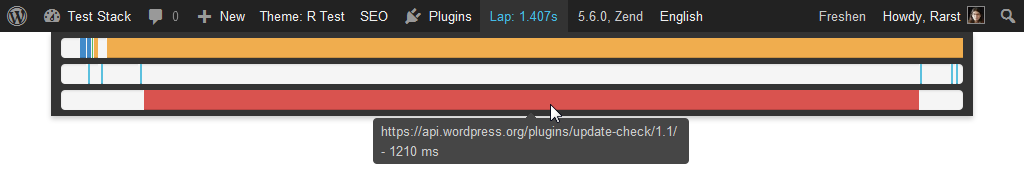
Internet is lying to you
- Enable profiler extension…
- Load the page to profile…
- Find the resulting profile file…
- Launch the profile viewer application…
- Load the profile file in viewer application…
Bullshit.
goal 2
0..2 clicks
Low setup, low detail
- easy to install
- minimal requirements
- primarily totals information
var_dump() of profiling
printf(
	'%d queries in %.3f seconds, using %.2fMB memory',
	get_num_queries(),
	timer_stop( 0, 3 ),
	memory_get_peak_usage() / 1024 / 1024
);
// 3 queries in 0.251 seconds, using 4.42MB memory
Symfony Stopwatch
$stopwatch = new Stopwatch();
$stopwatch->start( 'eventName' );
// some code goes here
$event = $stopwatch->stop( 'eventName' );
echo $event->getDuration(); // 202
echo $event->getmemory(); // 3670016
symfony.com/doc/current/components/stopwatch
Laps
- common load stages
- database queries
- HTTP requests
github.com/Rarst/laps
High setup, high detail
- (relatively) hard to install
- require PHP binary extension
- highly detailed information
XHProf / uprofiler
- open source
- lightweight
- lingua franca format
github.com/FriendsOfPHP/uprofiler
Blackfire
- in beta
- hosted service
- nice user interface
blackfire.io

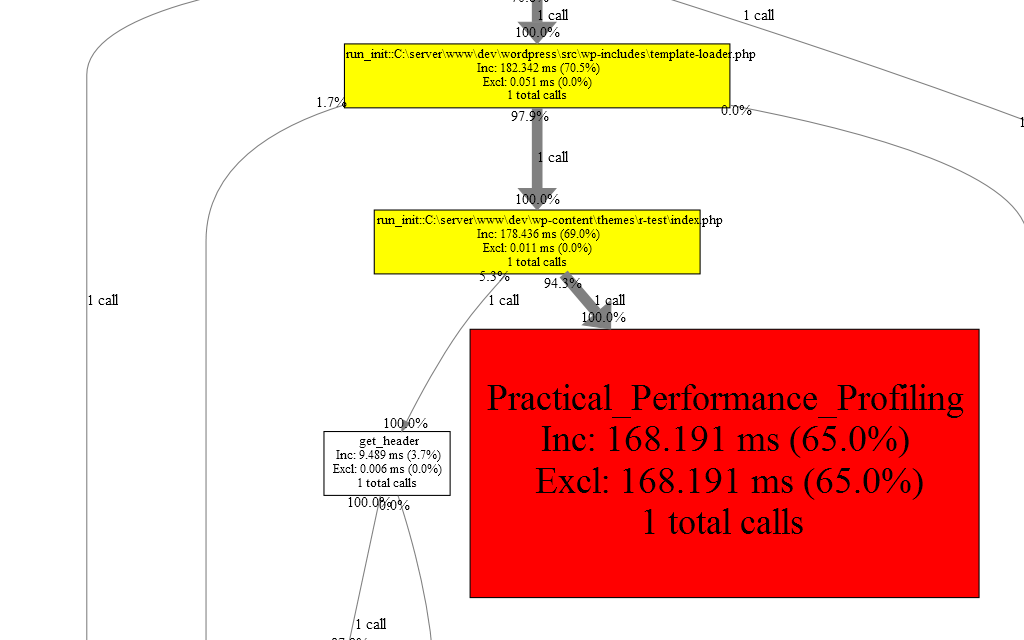
Practical performance profiling
- bookmarklet trigger
- web viewer
Complete in–browser workflow.
Hands off, always on
- automated data collection
- looking for anomalies
- in multiple contexts
New Relic
- involved server setup
- collects from many technologies
- dumbs it down magnificently
newrelic.com

WP Performance Profiler
- WordPress plugin
- pure PHP ( no extension )
- contexts ( front/admin/cron/ajax )
wpperformanceprofiler.interconnectit.com
next monday
install Laps
a while later
question results